
NBA Injury Impact on Player Prop Lines 2026
 Available in US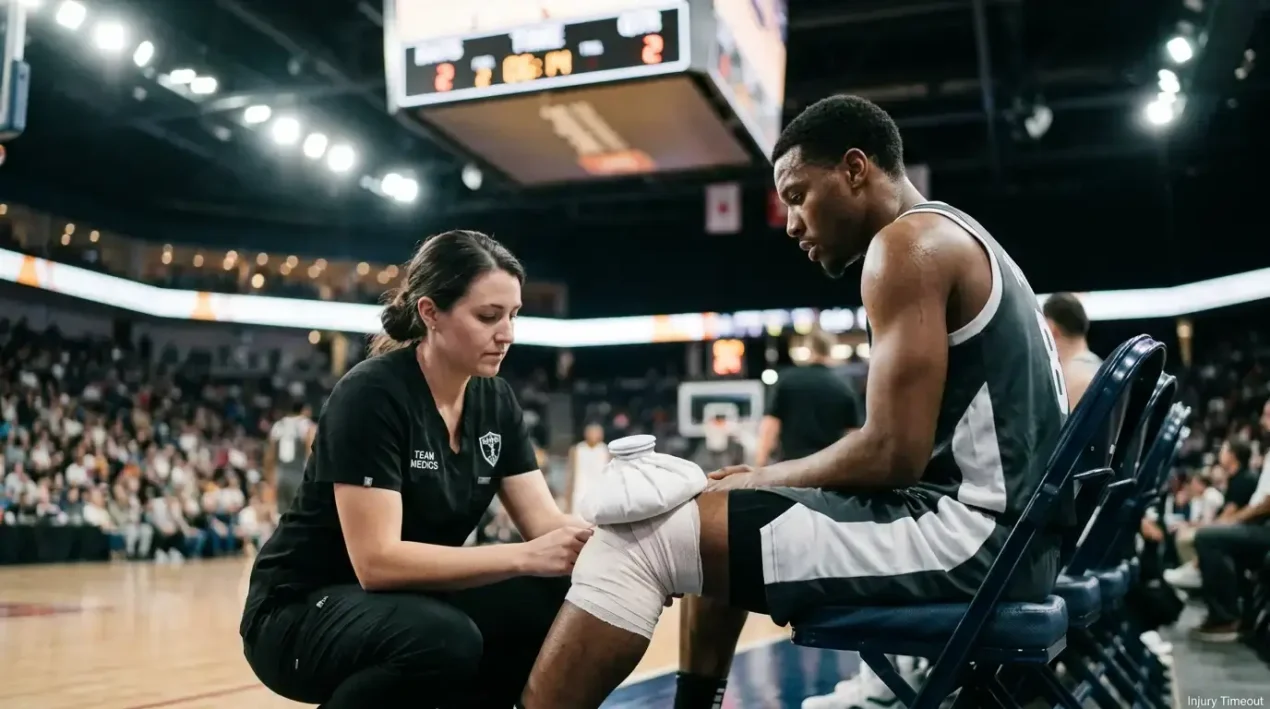
Injury Report Ripple Effects: How Absences Reallocate Teammate Usage Rates
When a team’s leading scorer is ruled out two hours before tip-off, the obvious reaction is to void any prop bet on that player and move on. But the real opportunity is not the player who is missing — it is everyone else on the roster whose role just changed. I learned this the hard way years ago when I ignored an injury report and watched a backup guard drop 28 points because the starting point guard was sitting with a hamstring strain. The backup’s points line had been set at 12.5. It was the easiest over I never bet.
NBA rosters are ecosystems. Every player’s statistical output depends on who else is on the floor, how many minutes they play, and what percentage of the team’s possessions flow through their hands. Remove one player from that ecosystem and every prop line on the roster should, in theory, recalibrate. In practice, bookmakers are fast at adjusting the most obvious lines — the injured player’s own props and the primary backup’s — but slower at repricing the secondary and tertiary effects. That lag is where informed punters find edge.
SportsLine analyst Doug Kralstein tracks these cascading effects game by game, noting how specific absences reshape the stat lines of remaining players. It is the kind of granular work that separates reactive betting from strategic analysis. With bookmakers setting 200-250 individual prop lines per game day, even a small delay in adjusting the less obvious lines creates a window of opportunity that lasts until the algorithm catches up.
Usage Redistribution: Where the Missing Minutes Go
Every NBA player who sits out leaves behind a specific number of minutes, shots, and touches. Those resources do not vanish — they redistribute across the remaining roster, and the pattern of redistribution is surprisingly predictable if you know where to look.
The most straightforward redistribution is minutes. If a starter who played 34 minutes per game is out, those 34 minutes are absorbed primarily by two players: the direct replacement in the starting lineup and the first guard or wing off the bench who now slides into a larger role. The starter’s backup might go from 18 minutes to 30, and a bench player who averaged 14 minutes might jump to 22. Those minute increases directly inflate counting stats — more time on the floor means more opportunities to score, rebound, and assist.
Shot attempts follow a less linear path. If the missing player was a high-usage scorer taking 18 shots per game, those shots do not redistribute evenly. The team’s next-best option in the half-court offence absorbs the largest share — perhaps 5-7 additional shot attempts — while the rest scatter across role players in smaller increments. The key insight for prop betting is that the player who absorbs the most additional shots is not always the direct positional replacement. It is often the team’s best remaining scorer, regardless of position.
Backtested data from the 2025-26 season shows that high-variance stat categories like blocks and steals — where unders historically hit at rates of 69.9% and 61.9% respectively — become even more volatile in injury scenarios. If the team’s primary shot-blocker is out, the replacement centre’s blocks prop is genuinely unpredictable because rim protection depends on defensive scheme as much as individual ability. The metrics that predict these shifts are usage rate, minutes played in previous games without the injured player, and the team’s offensive rating with and without the absent star.
Historical On/Off Splits: the Best Tool for Injury Scenarios
If you want to know what happens to a point guard’s assists when the starting centre sits out, the single best data source is the team’s on/off splits with that specific pairing. Every major stats site publishes these — they show how the remaining players performed in minutes when the injured player was on the bench during games he did play.
The logic is straightforward. If the centre played 32 minutes per game but sat for 16 minutes of each game on the bench, there are roughly 16 minutes of data per game where the remaining players operated without him. Over a full season, that accumulates to a meaningful sample. If the point guard’s assist rate was 38% with the centre on the floor and 29% without him, you have quantitative evidence that the centre’s absence will suppress the point guard’s assist production — perhaps enough to make the assists under attractive.
The limitation is sample size. On/off splits drawn from bench minutes are not the same as a player being absent for an entire game. When the star sits for five minutes in the second quarter, the coach is not making the same tactical adjustments he would make if that player were ruled out entirely. Rotations change, game plans shift, and the replacement player might be asked to do things that the on/off data does not capture. Use on/off splits as directional evidence, not as precise projections.
The best injury scenarios for prop betting are the ones where the absent player has already missed several games earlier in the season. If a centre has missed 8 games with a knee issue, you have 8 full games of data showing exactly how the team redistributes usage without him. That is a much richer dataset than on/off bench splits, and the prop lines for those 8 games give you a benchmark for where the bookmakers priced the remaining players in those situations.
When to Bet After Injury News Breaks
Timing is everything with injury-driven prop bets, and the window is narrow. The moment an injury report drops — typically between 1:00 PM and 5:30 PM Eastern time, which is 6:00 PM to 10:30 PM in the UK — the clock starts ticking. Major bookmakers adjust the most obvious lines within minutes: the injured player’s props come off the board, and the direct replacement’s lines move. But the secondary effects — the third option who gets two extra shots, the bench player whose minutes jump from 14 to 22 — take longer to reprice.
In my experience, the optimal window for injury-driven prop bets is 15-45 minutes after the report drops. Before 15 minutes, the initial repricing is still in progress and the lines are unstable. After 45 minutes, the market has largely settled and the easy edges have been priced out. Within that 30-minute window, you can often find props on secondary beneficiaries that have not yet moved to reflect the new reality.
The worst thing you can do is bet on the primary replacement without checking whether the line has already adjusted. If the starting point guard is out and the backup’s points line has jumped from 12.5 to 17.5, that might already fully reflect the expected increase. The value is more likely to be found in the backup’s assists line, which the bookmaker might not have adjusted as aggressively, or in the rebounding line of a power forward who is going to play more minutes with the centre out.
One final caution: “game-time decisions” are the bane of injury-driven betting. When a player is listed as “questionable” and the decision will not be made until warm-ups, the bookmaker keeps both sets of lines available but prices in the uncertainty. If you bet a teammate’s over expecting the star to sit, and the star plays, your bet is live at a line that was inflated by the possibility of an absence that did not materialise. Wait for confirmation whenever the injury status is genuinely ambiguous.
How quickly do bookmakers adjust NBA prop lines after an injury report?
Major operators typically adjust the most directly affected prop lines within 5-10 minutes of an official injury report. The injured player’s props are removed or suspended, and the primary replacement’s lines shift. Secondary effects — changes to the third or fourth option’s props, rebounding redistribution, and bench player minute increases — take longer, often 30-60 minutes. Smaller UK bookmakers with less NBA-specific trading infrastructure may lag further behind.
Which teammate props change most when a star player sits out?
The biggest changes typically occur in the prop lines of the player who absorbs the most additional usage — usually the team’s next-best scorer or primary ball handler, regardless of whether they play the same position as the absent player. Points and assists props see the largest adjustments because shot attempts and playmaking responsibilities redistribute most visibly. Rebounding props change less dramatically unless the absent player was a dominant rebounder, in which case the replacement centre or power forward’s line moves meaningfully.
This material was created by the PROPSWISH team.
Related posts
NBA Prop Bets vs Moneyline and Spread: a Side-by-Side for UK Punters
NBA Race to X Props and Game-Level Propositions: Beyond Player Markets